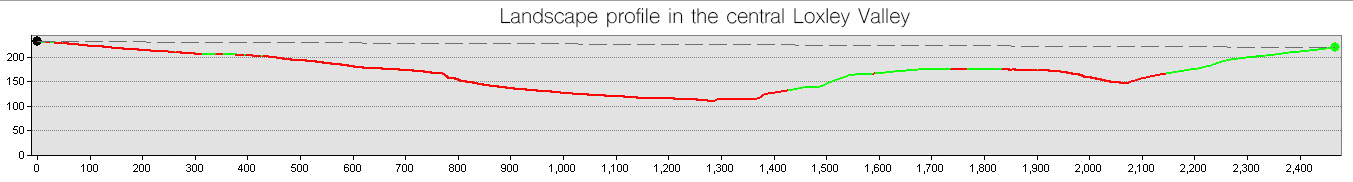
The output for this module is to define the different character areas of a defined section of the Loxley Valley. In order to do this I used multiple sets of data from digimaps exported into ArcGIS and then manipulated the data to create the maps shown below. I also created a section across the valley showing the different heights in relation to sea level, produced from the information on the relevant map.
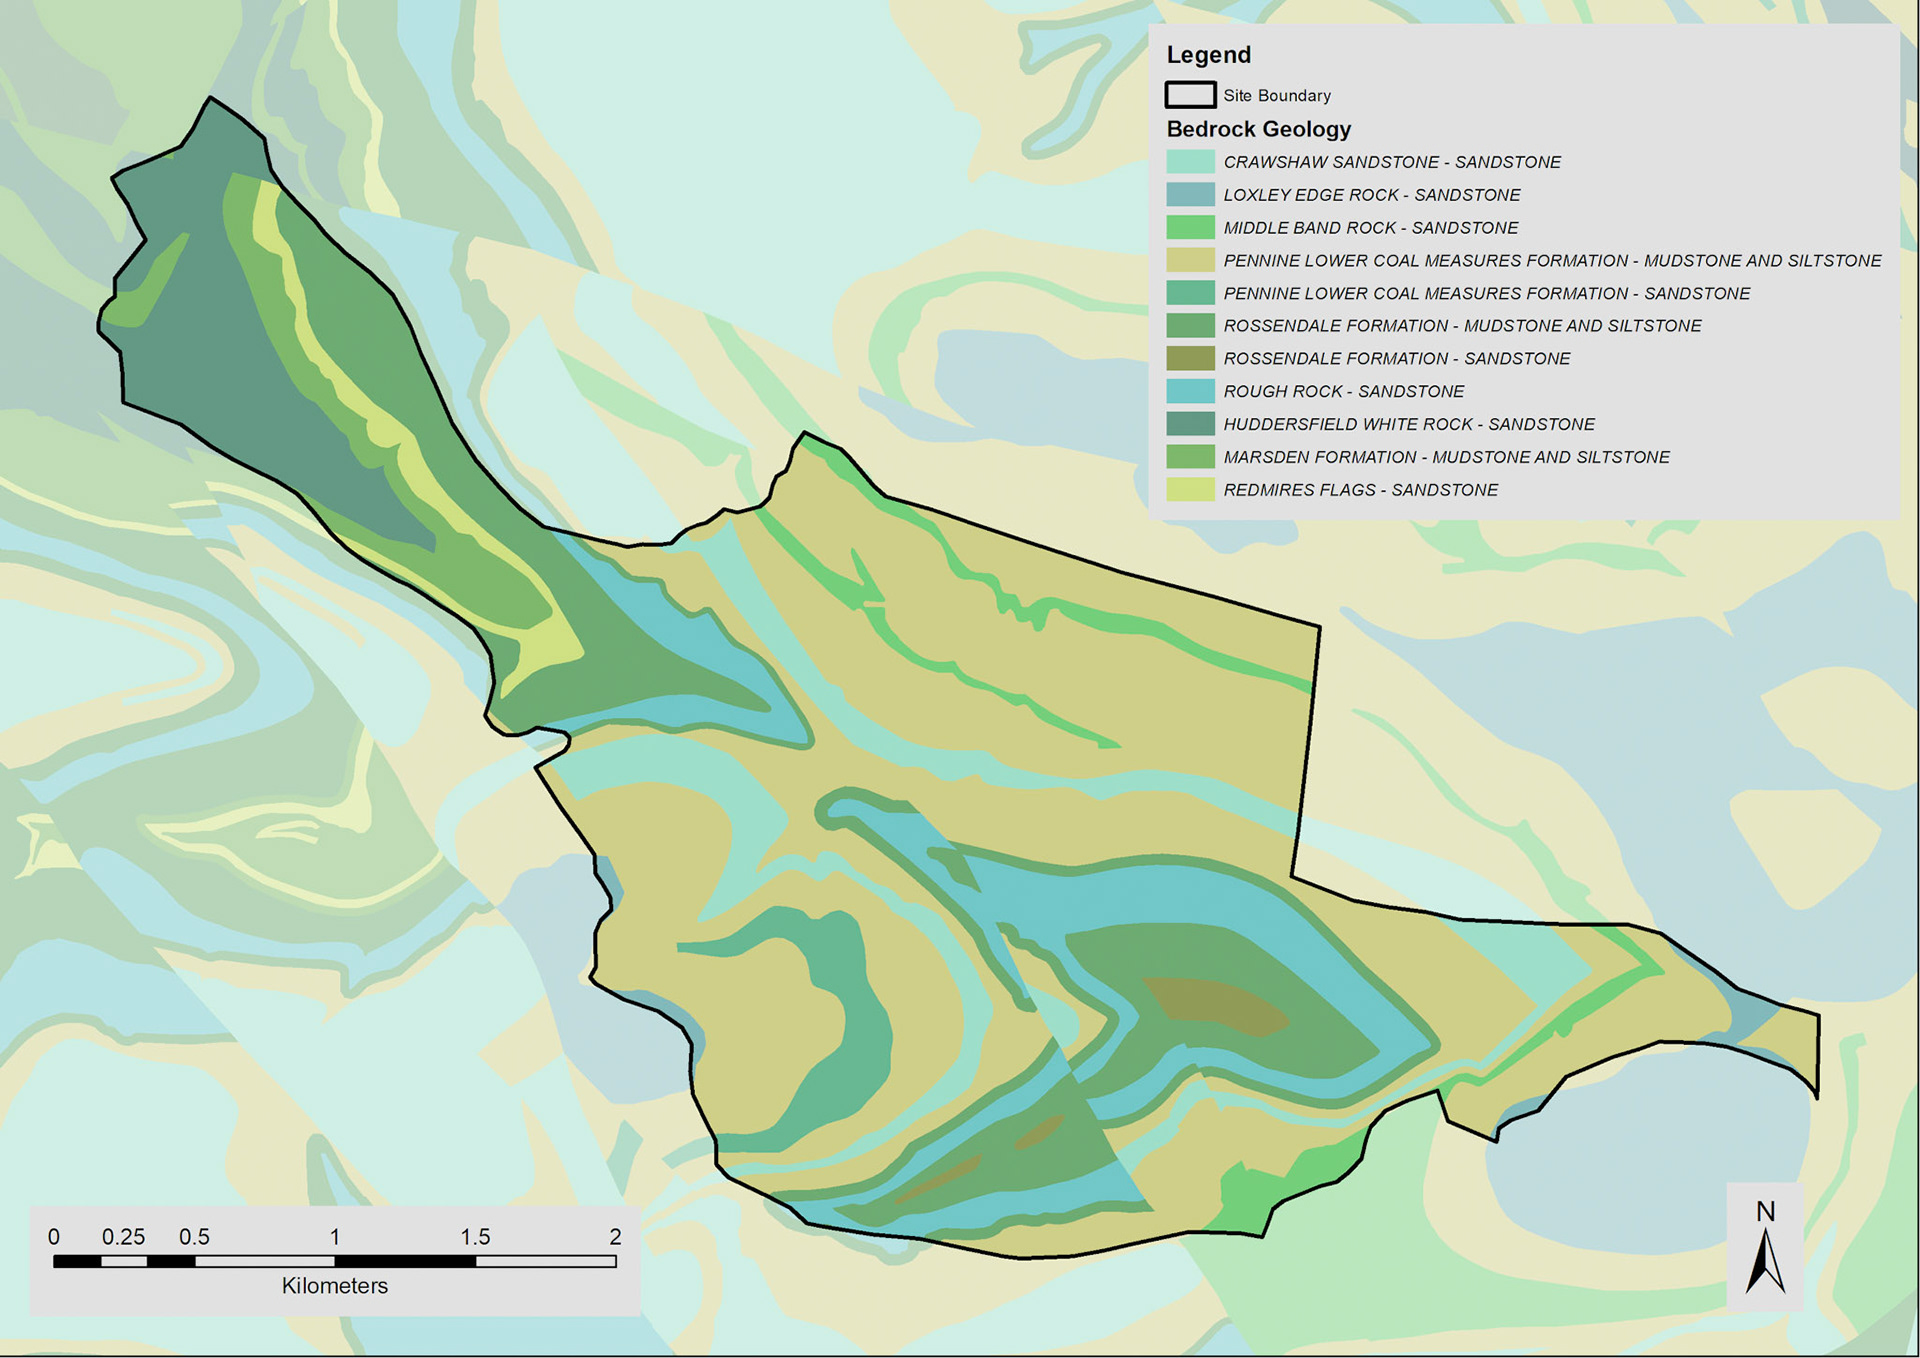
Geology
Vegetation
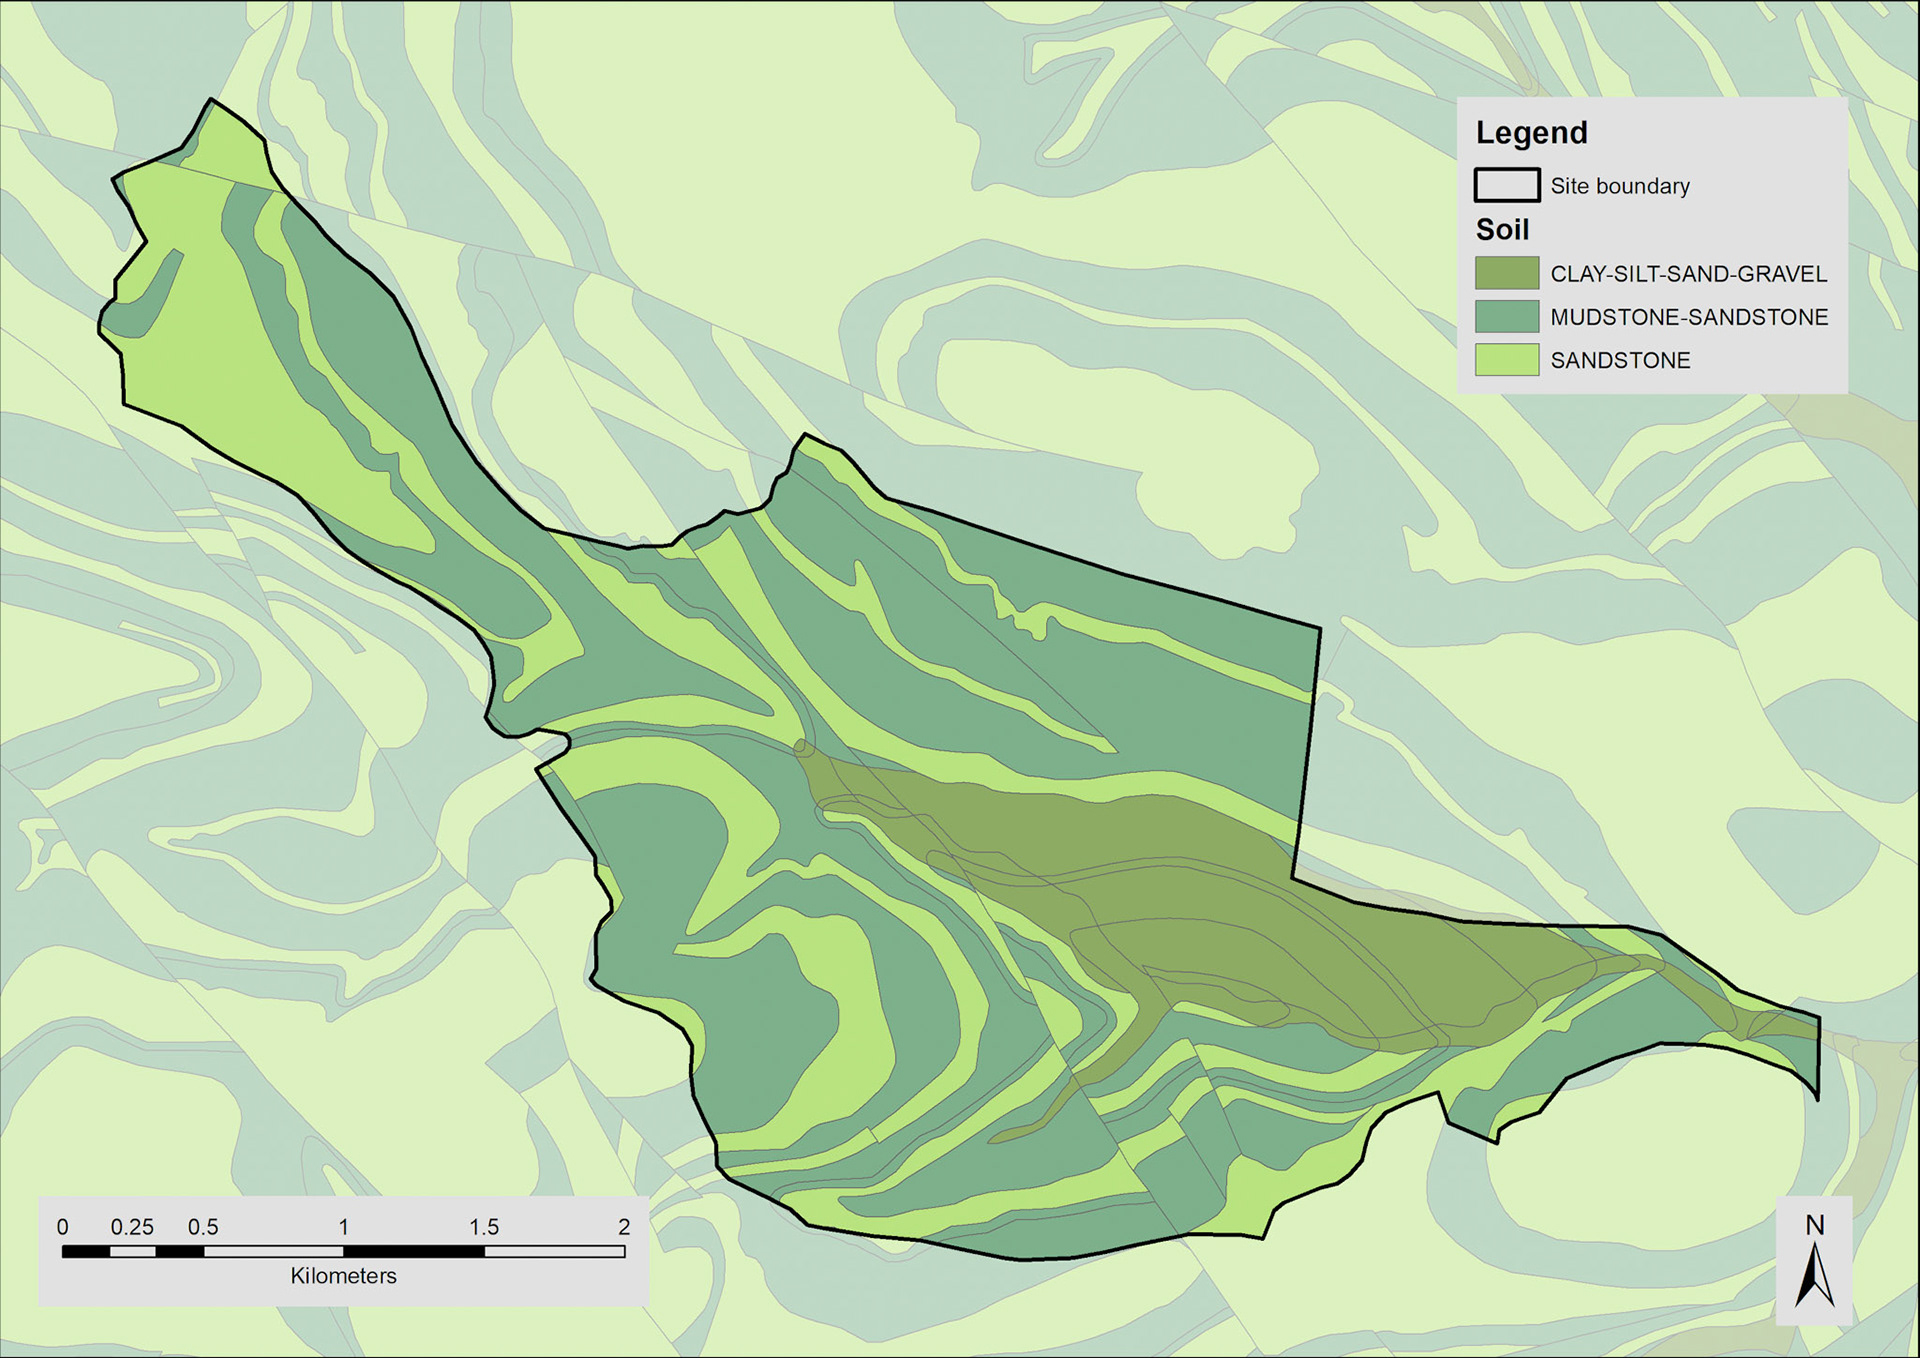
Soils
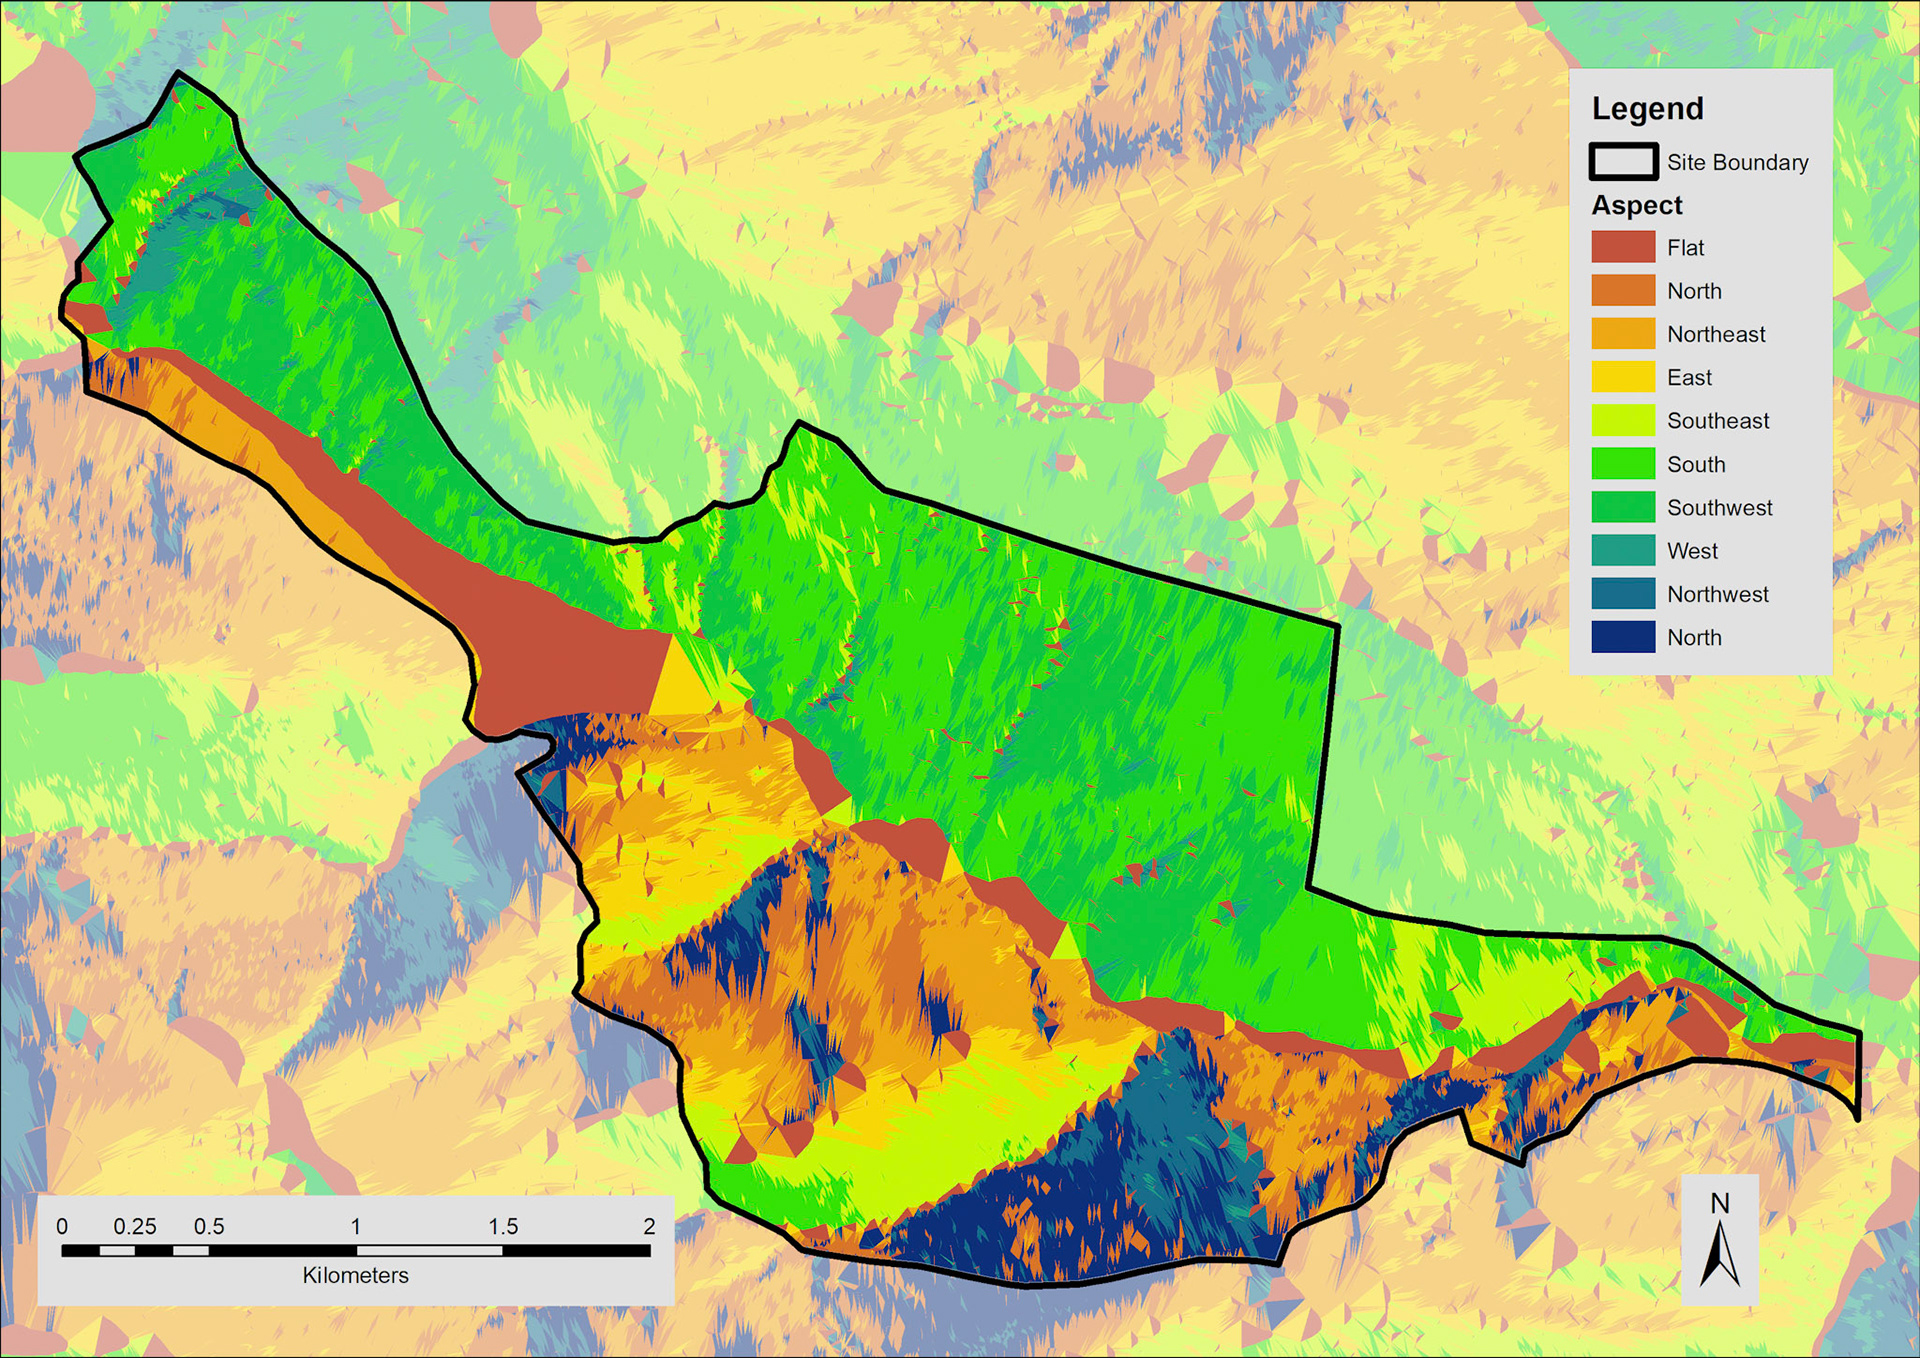
Landform - Aspect
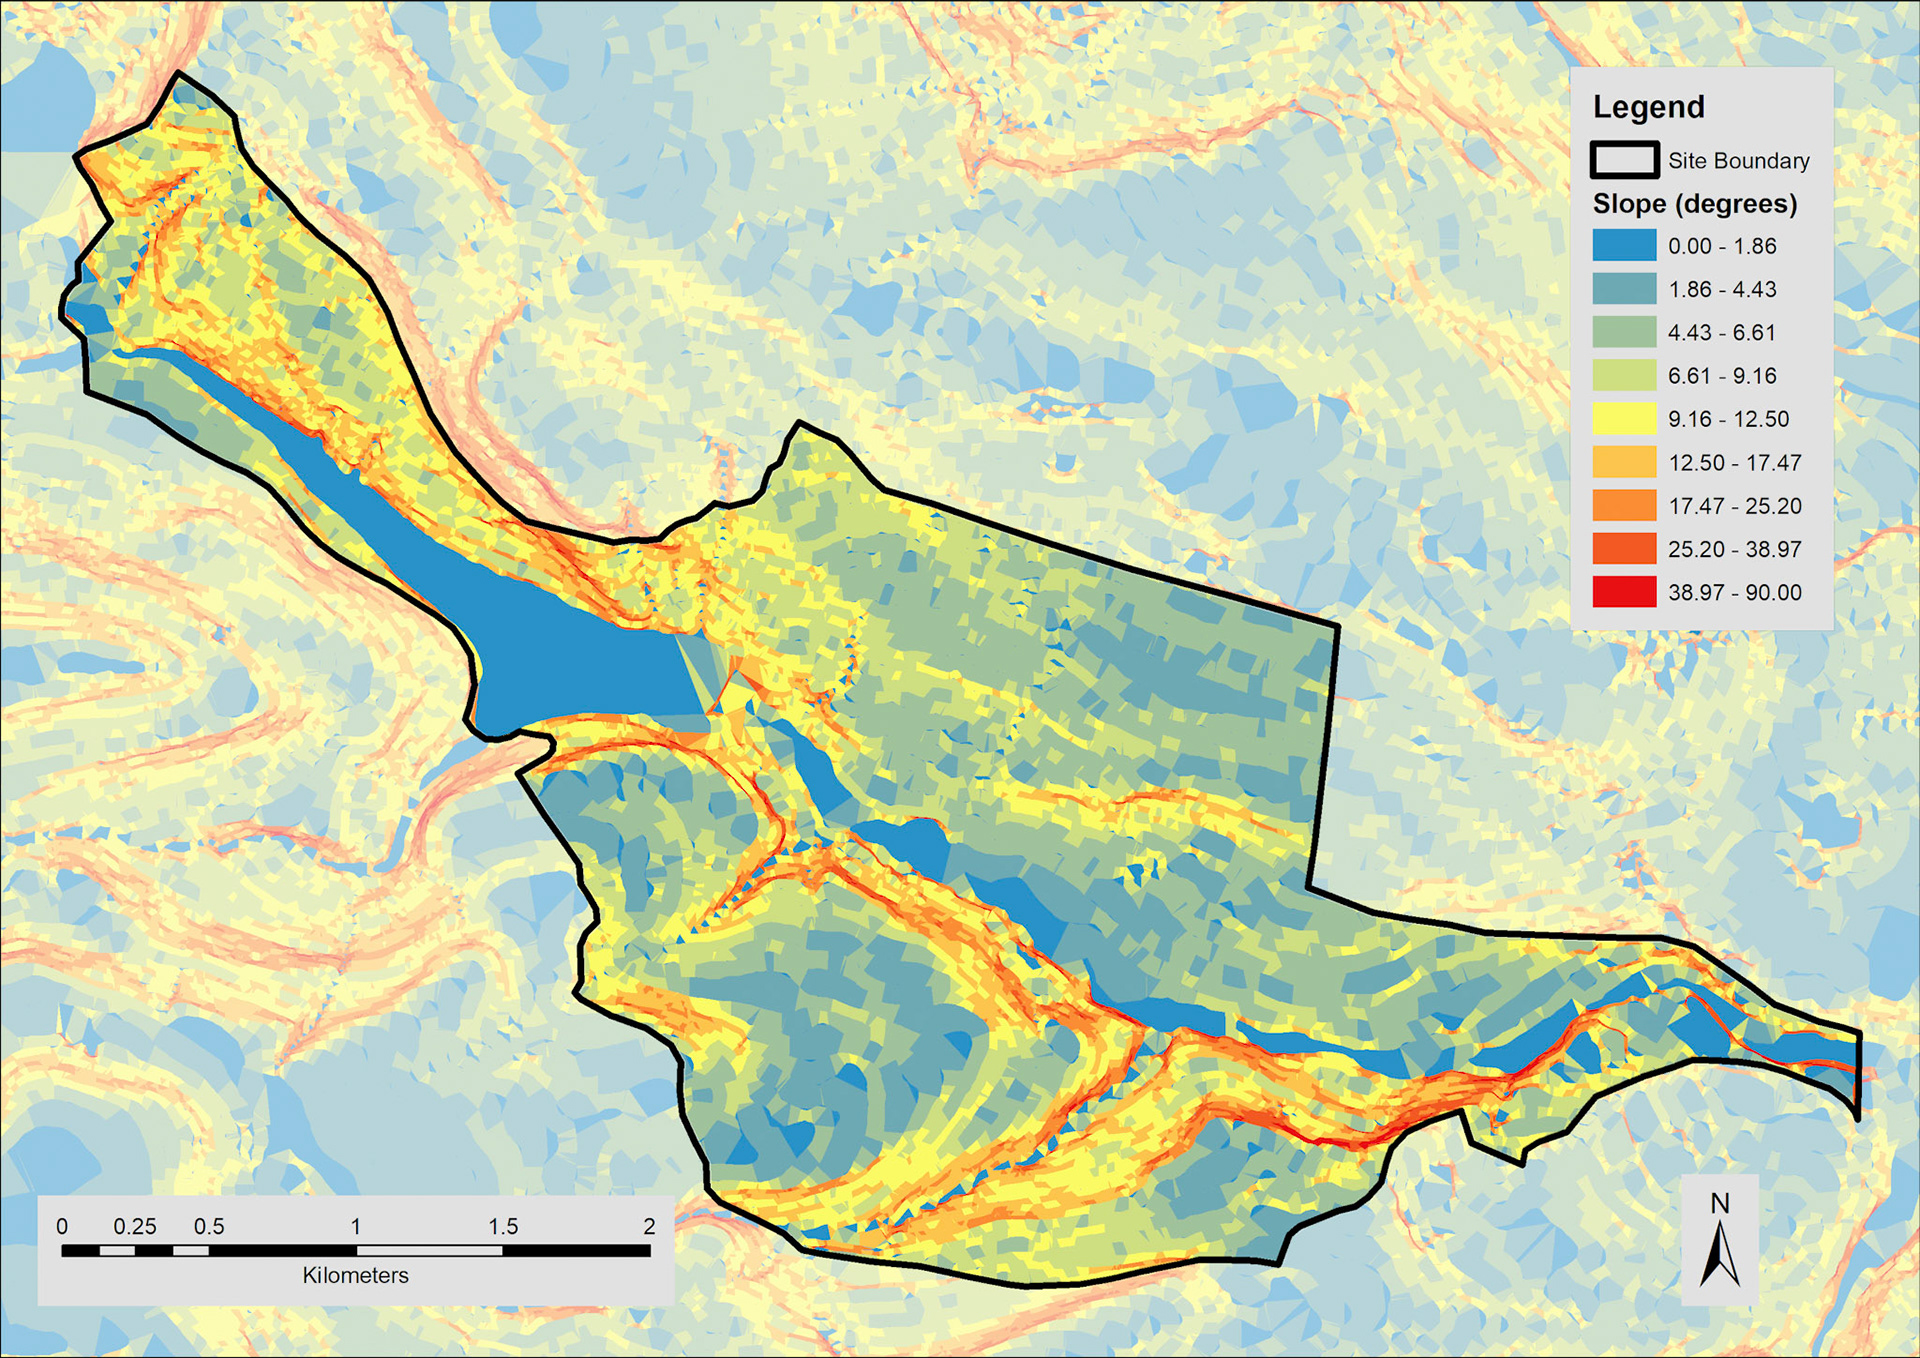
Landform - Steepness
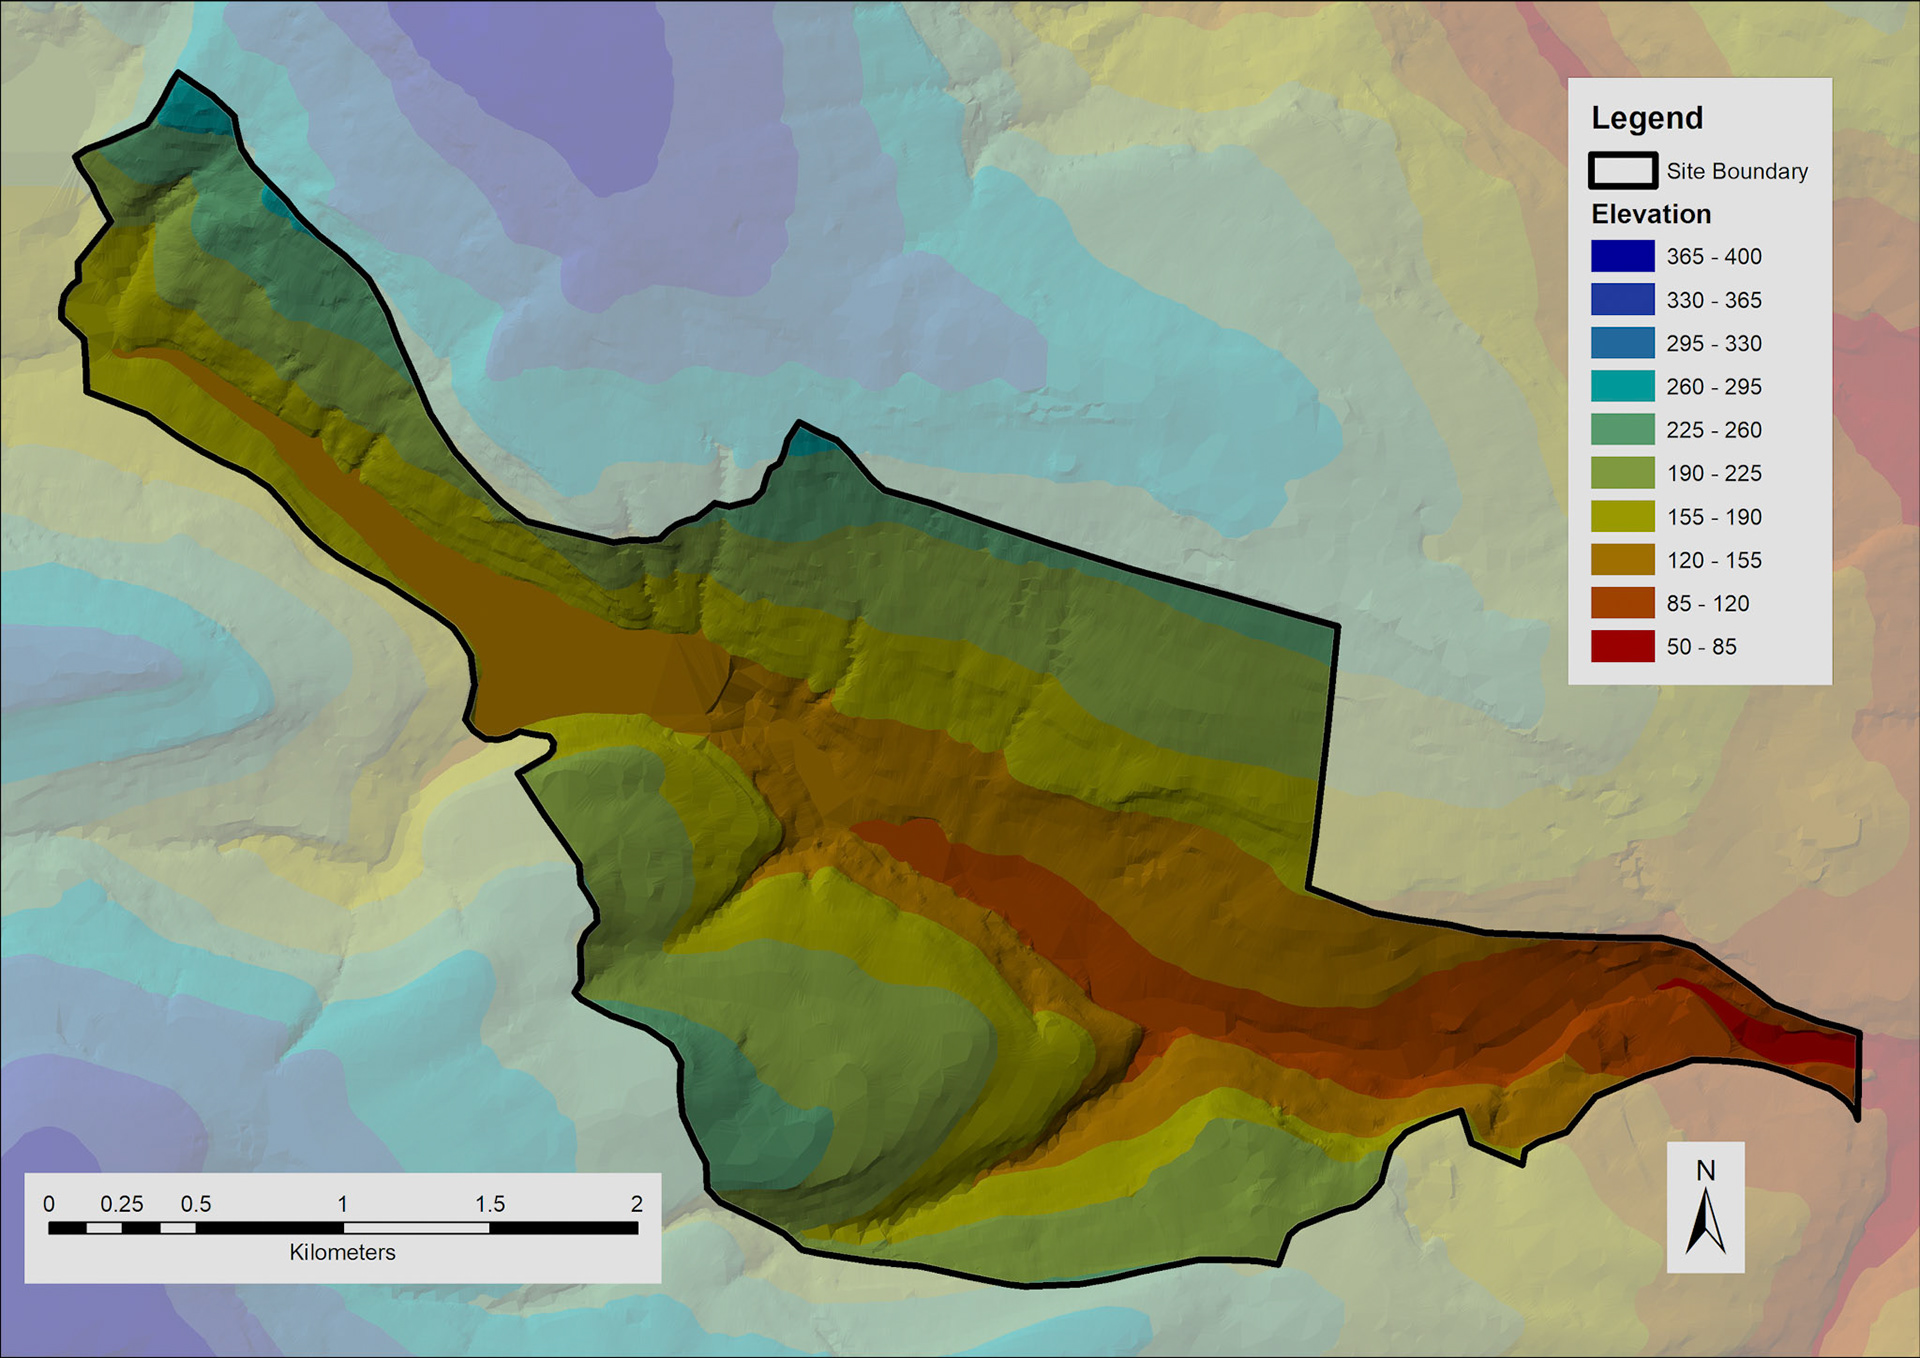
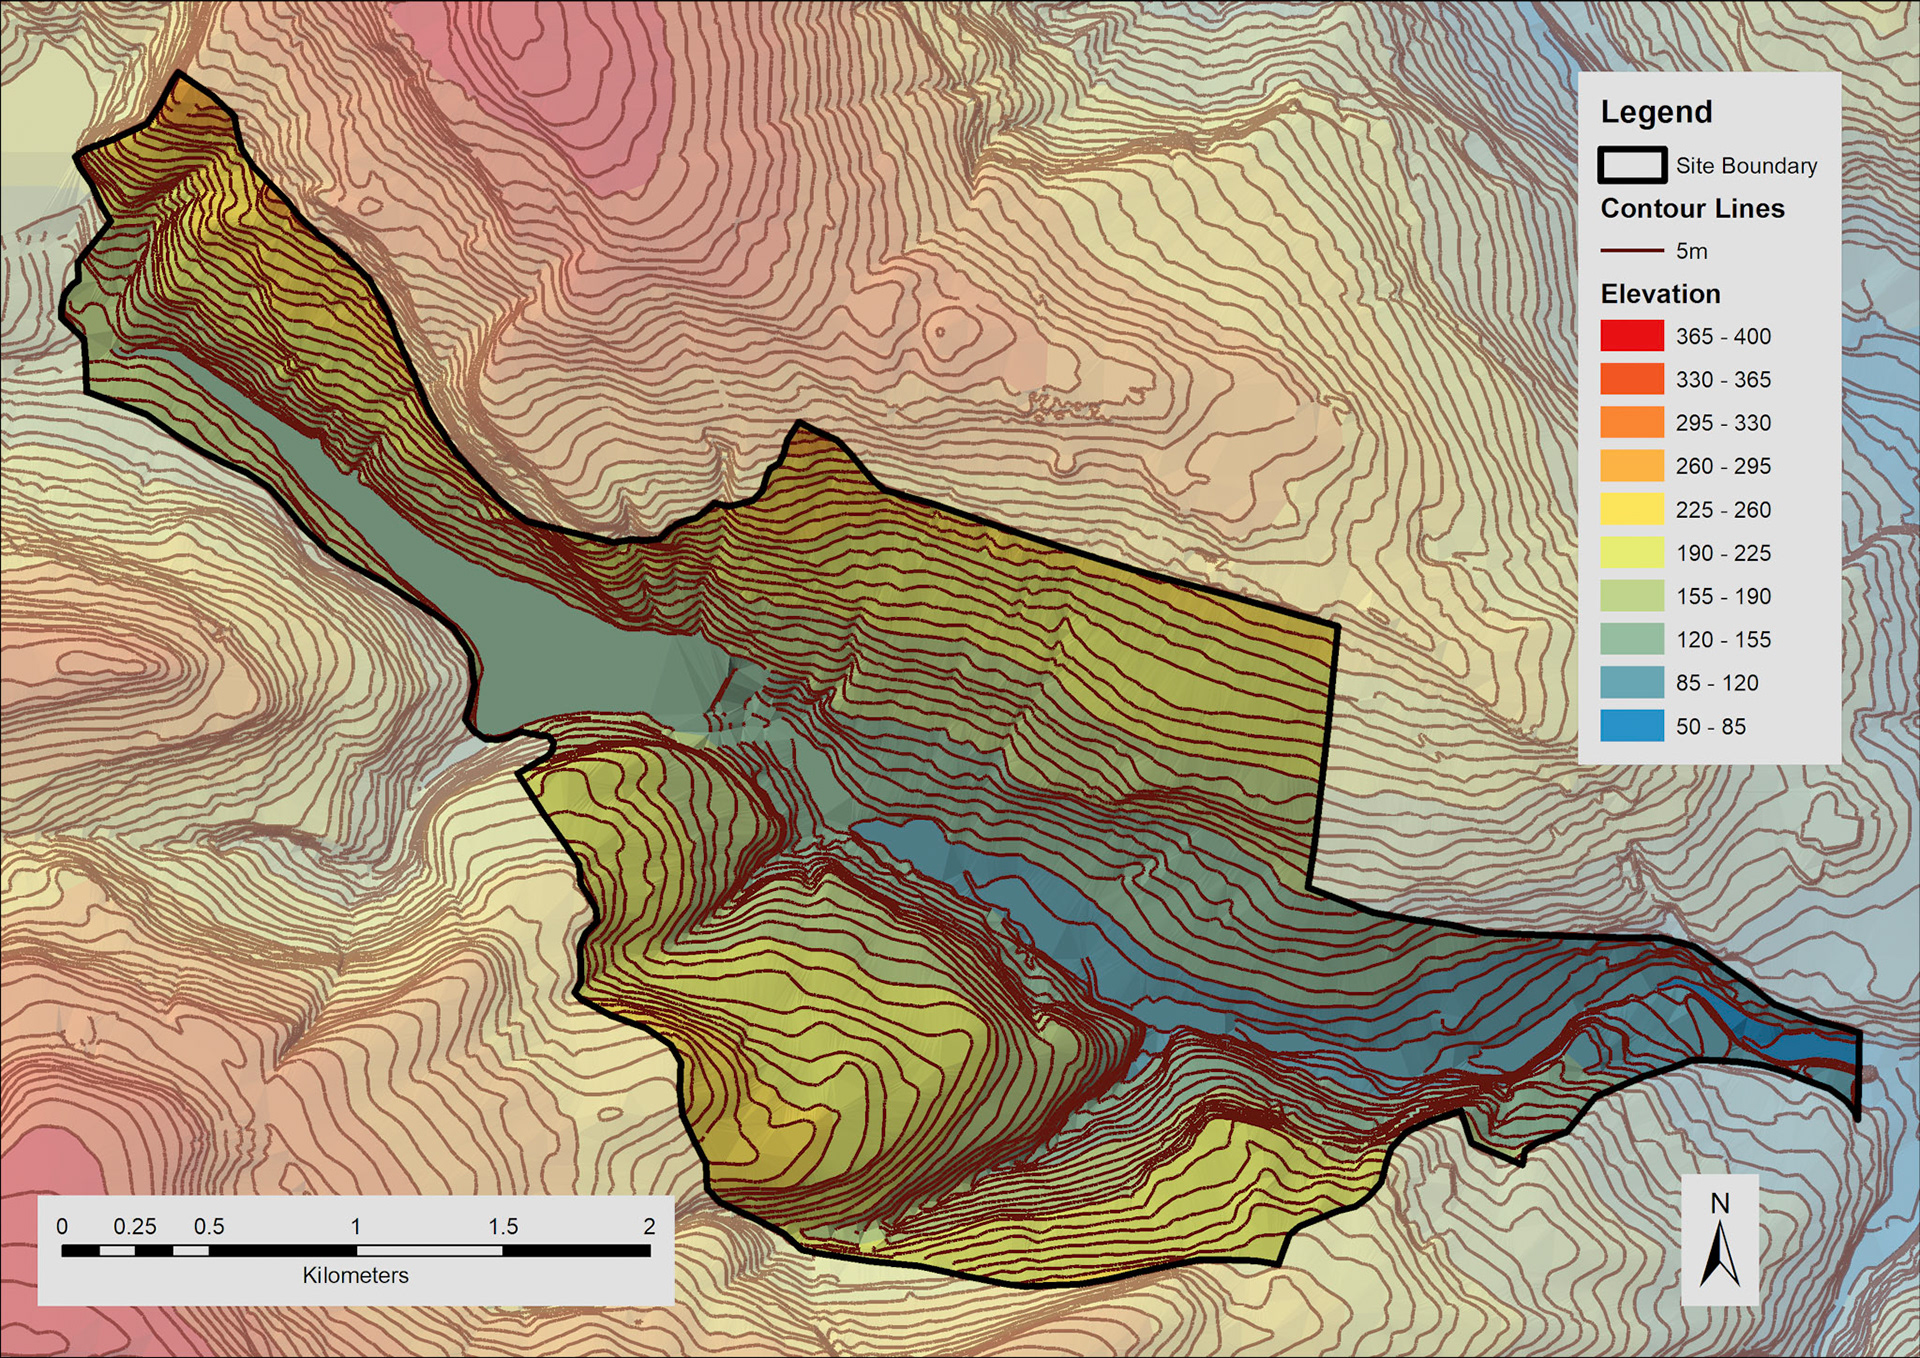
Landform - Elevation
Landform - Topography
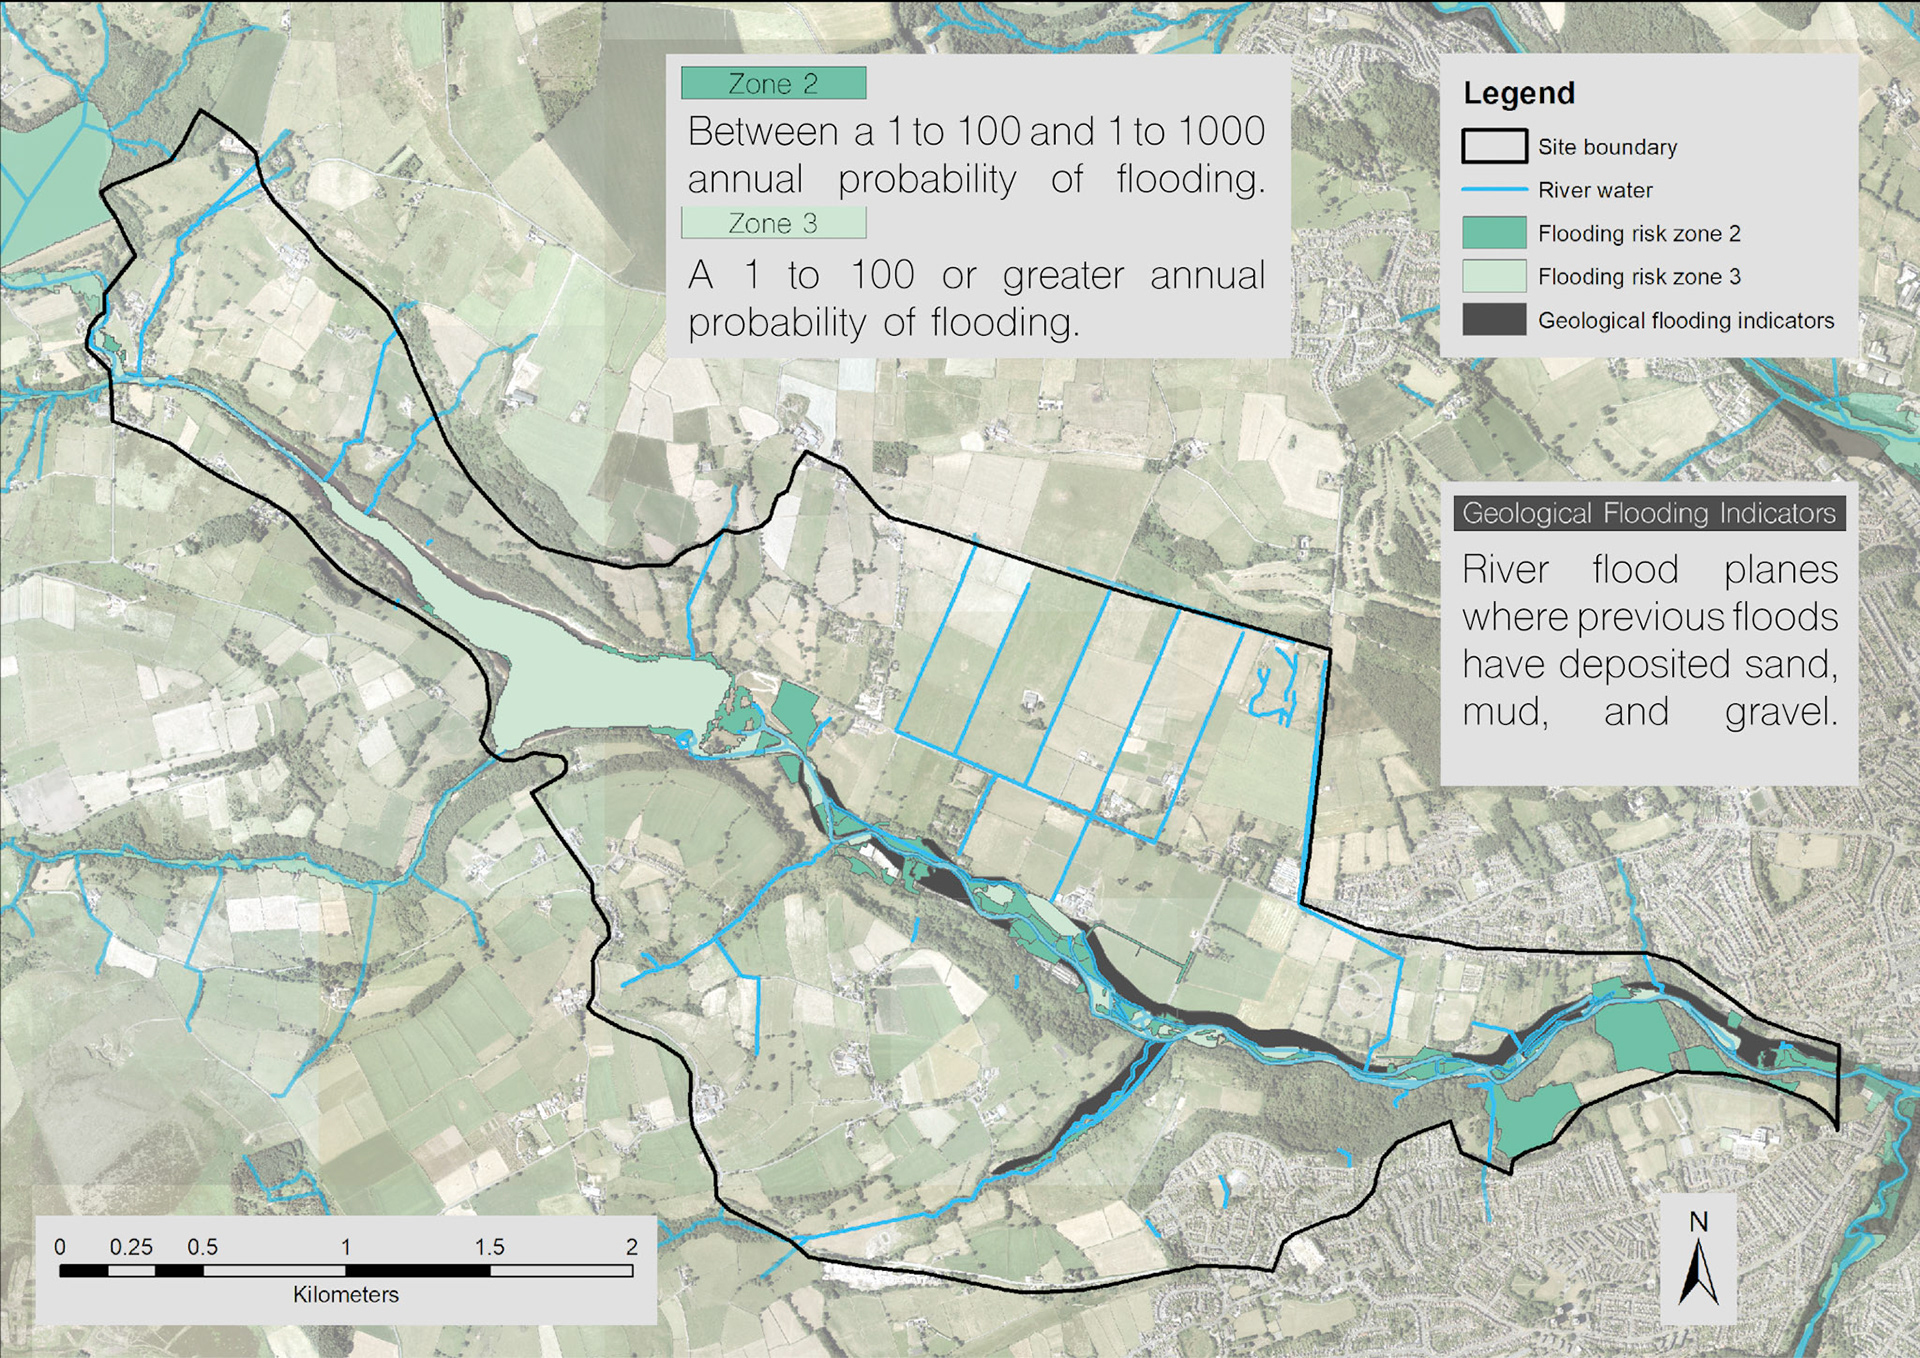
River and Drainage systems
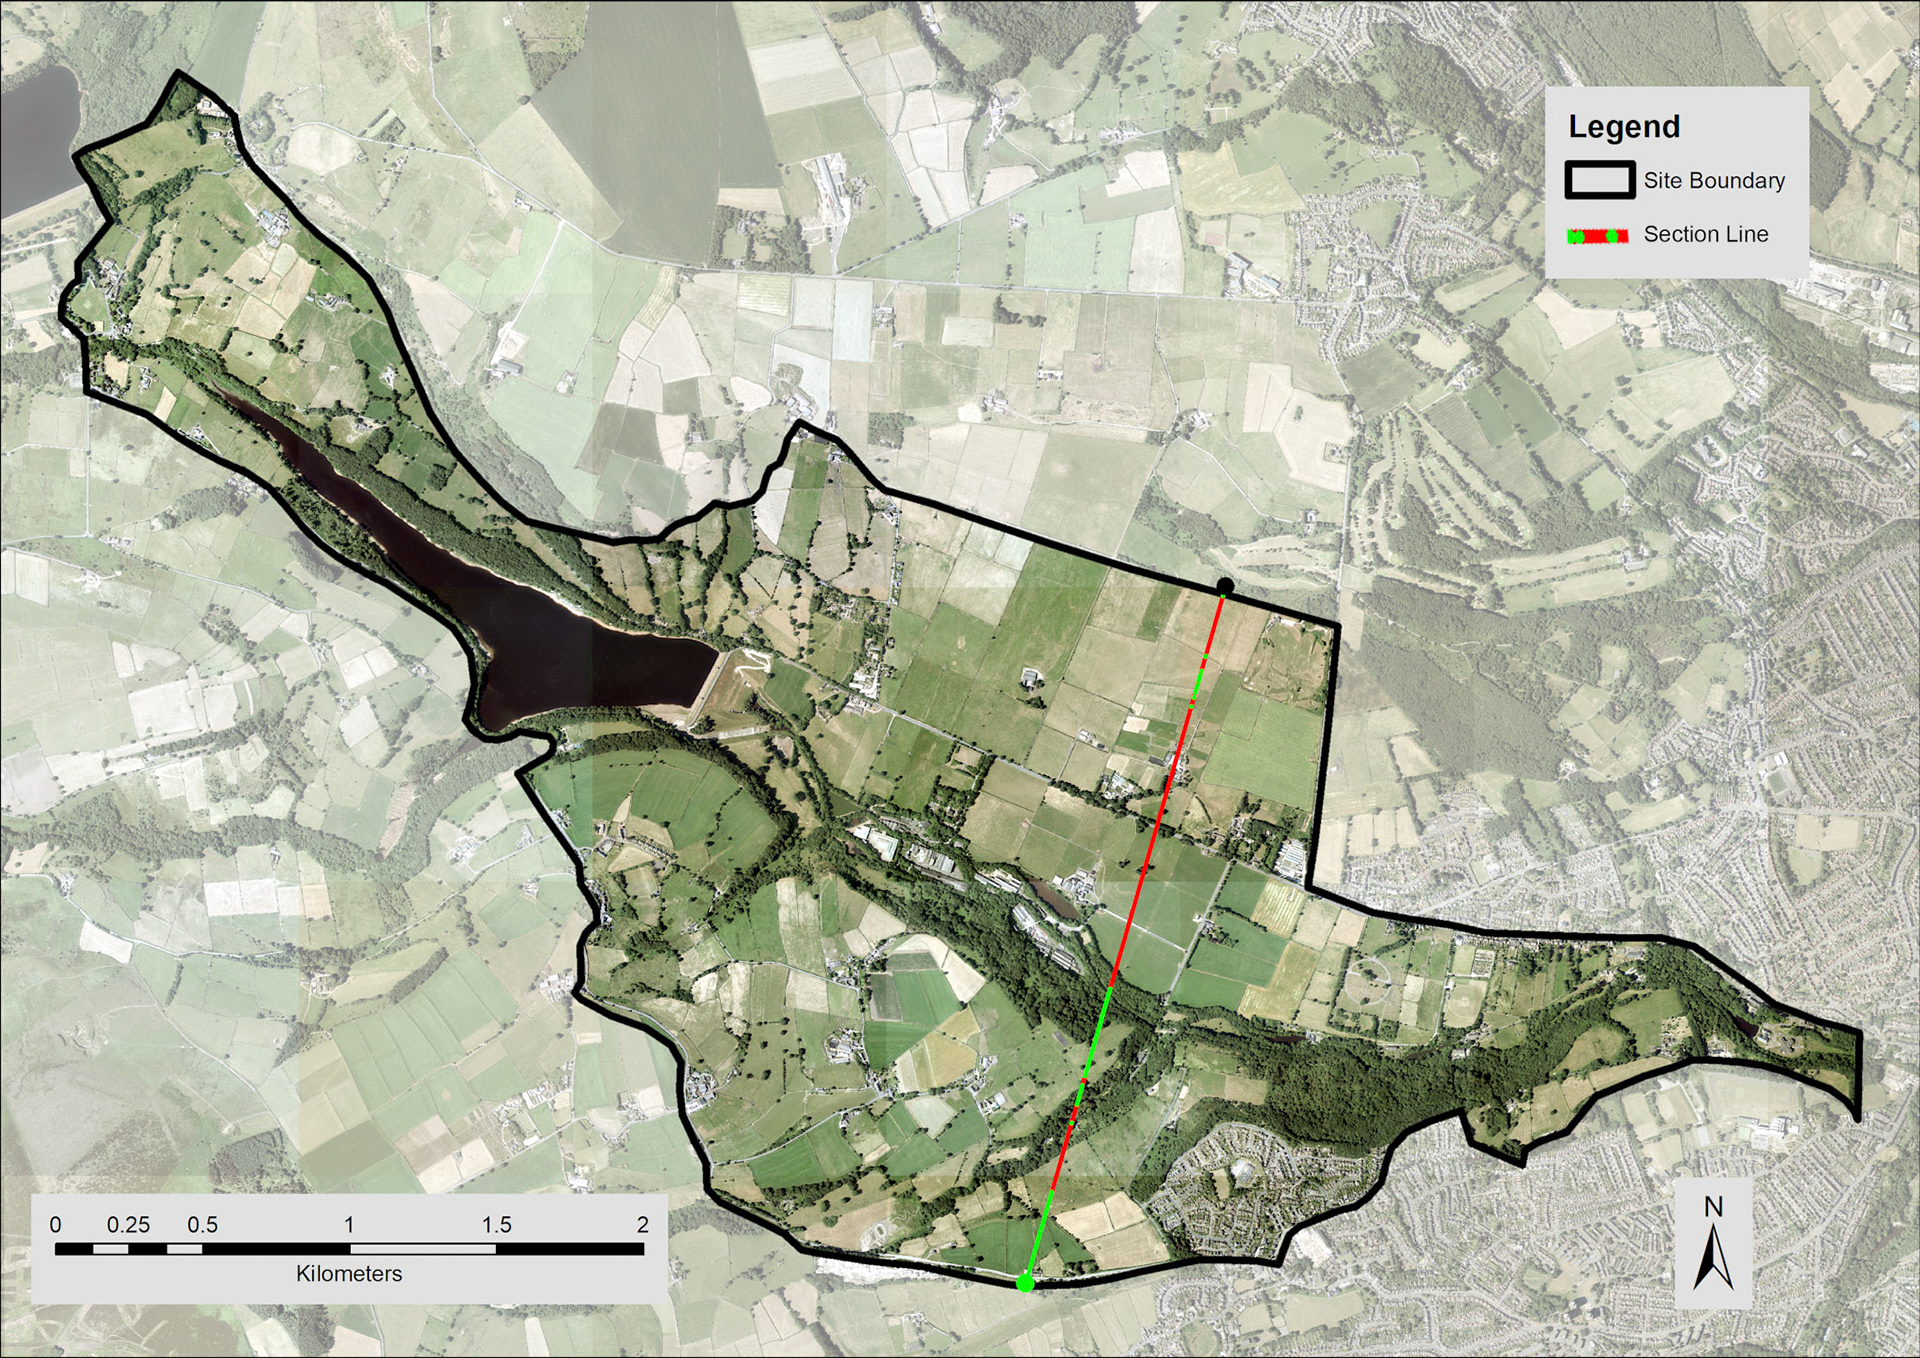
Landform - section relates to section line below
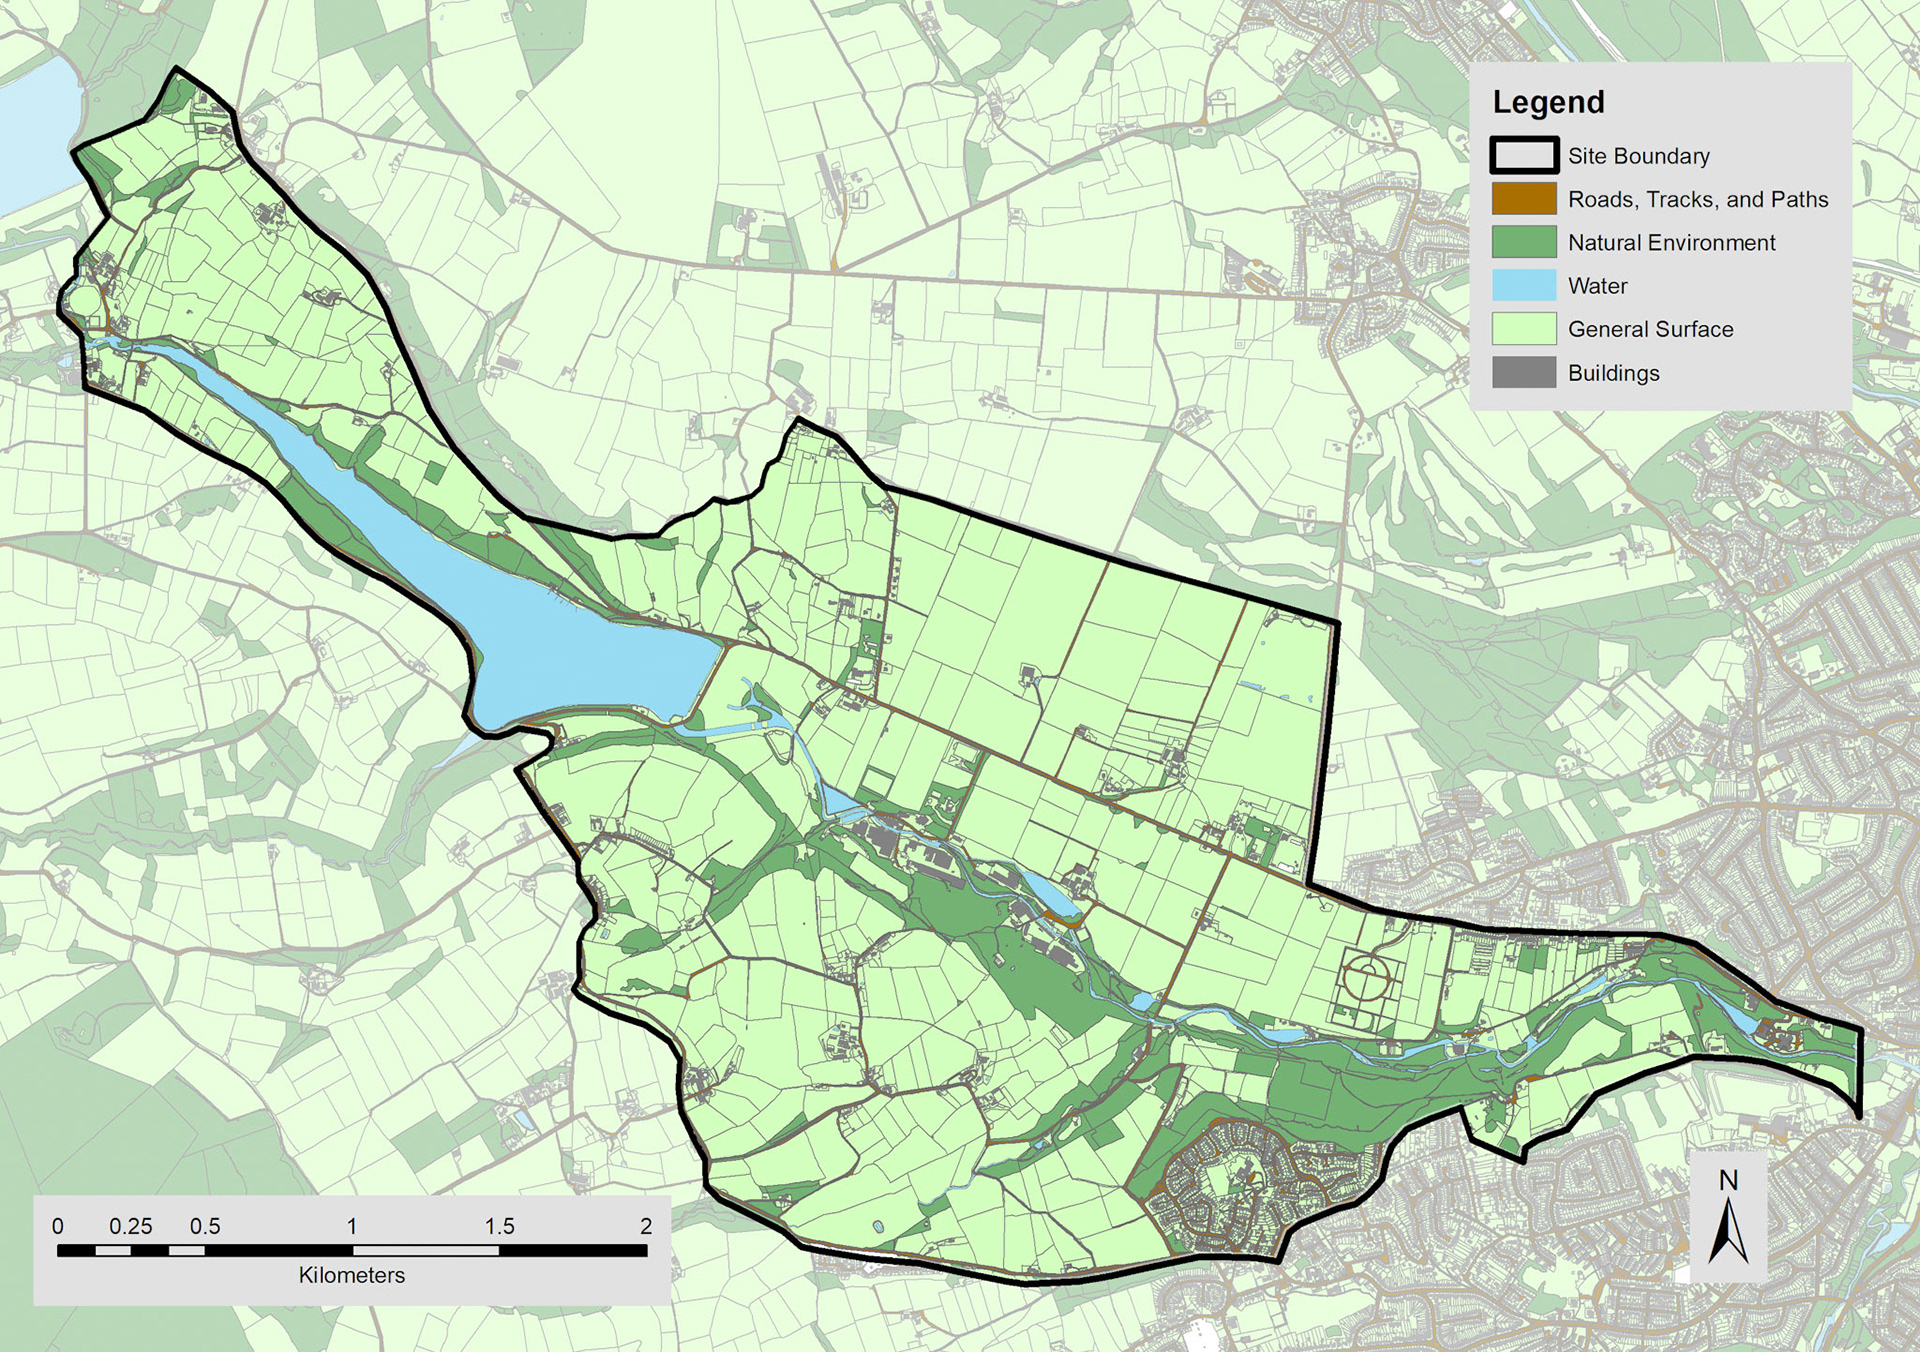
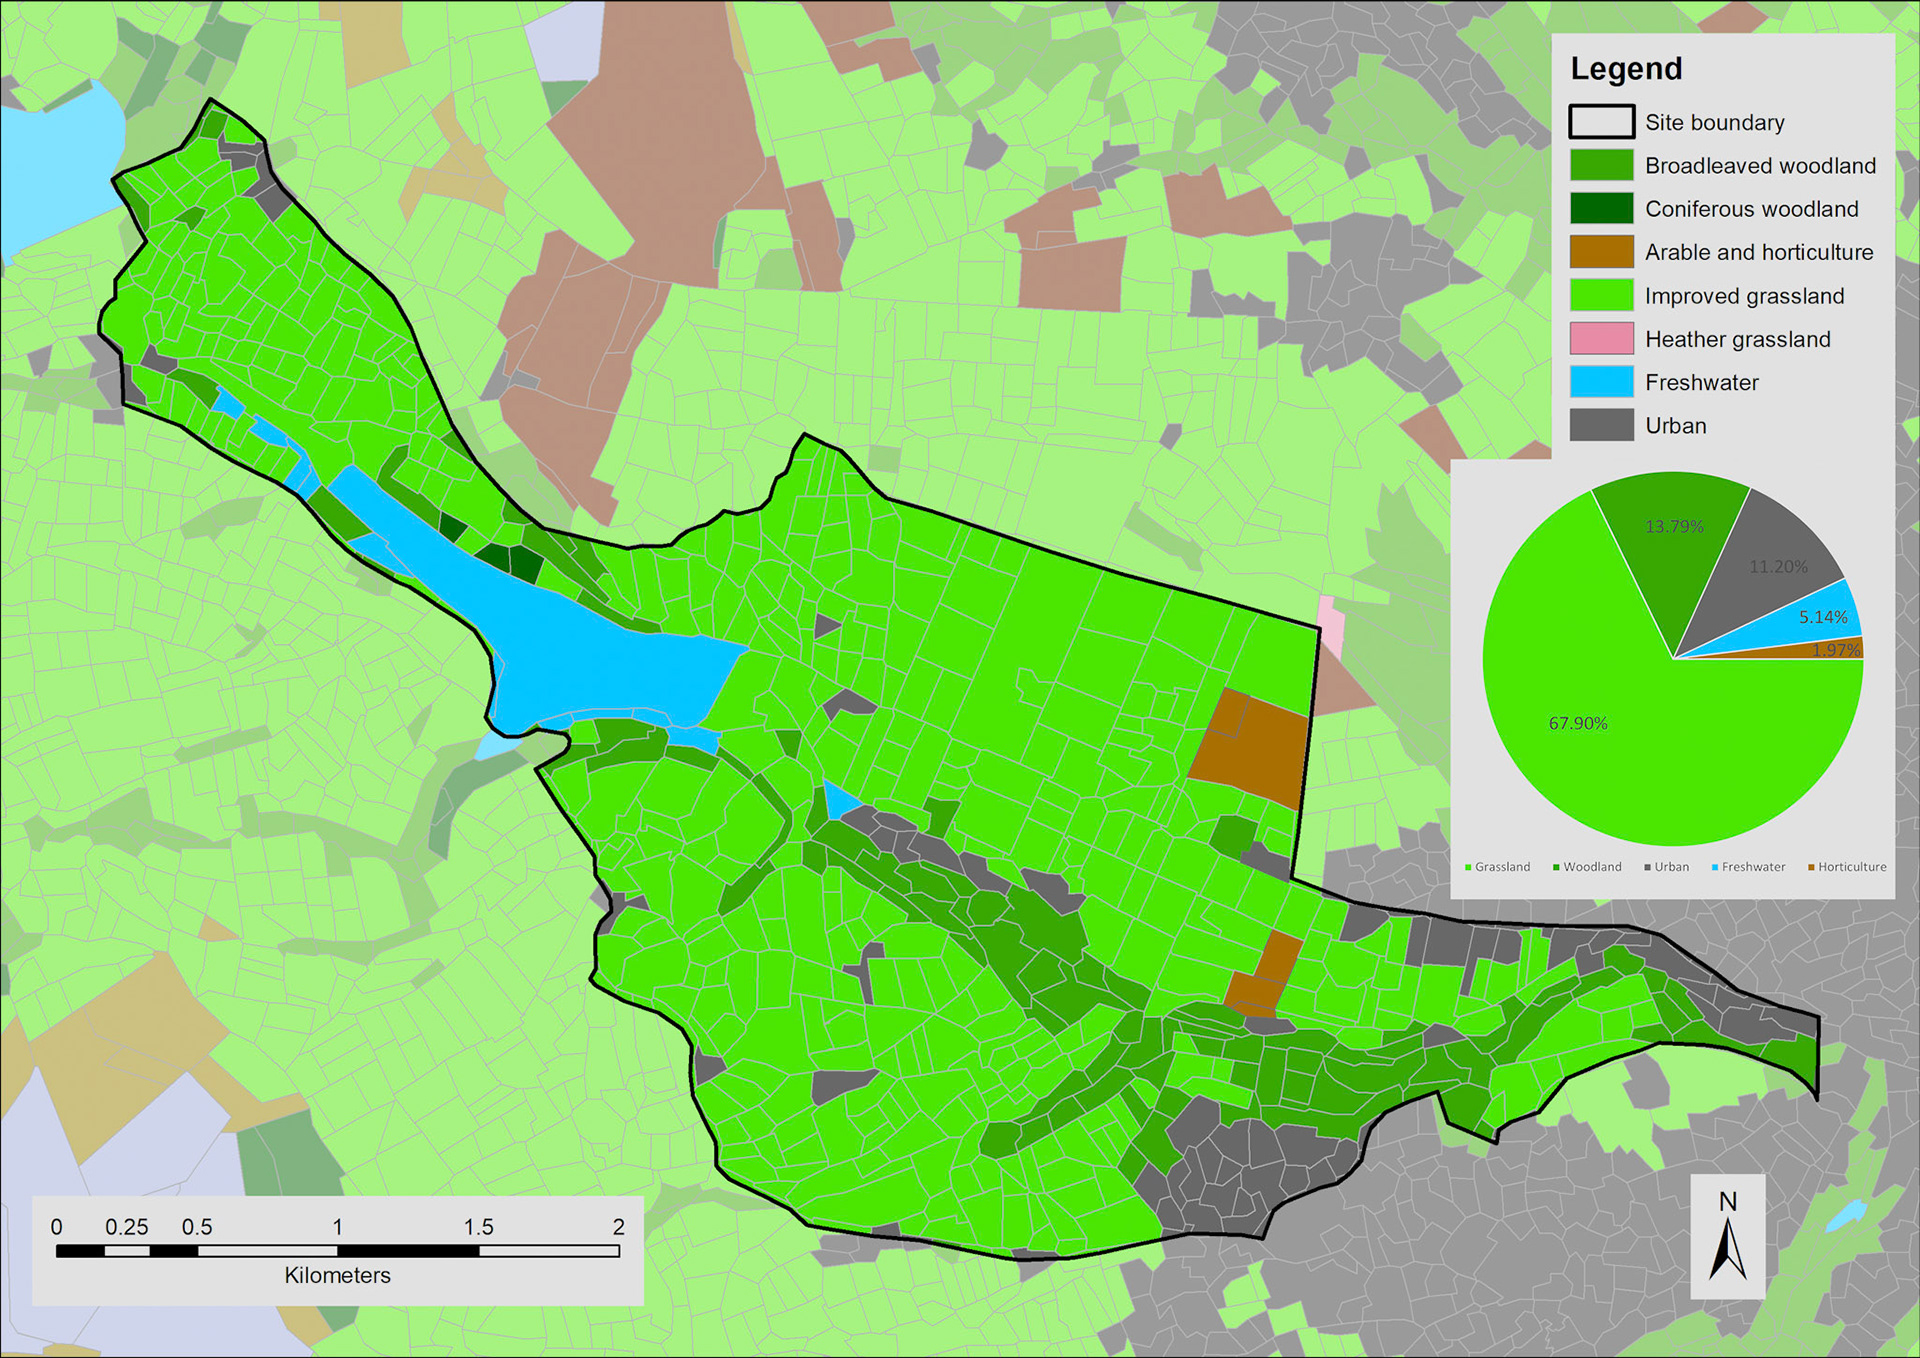
Land use
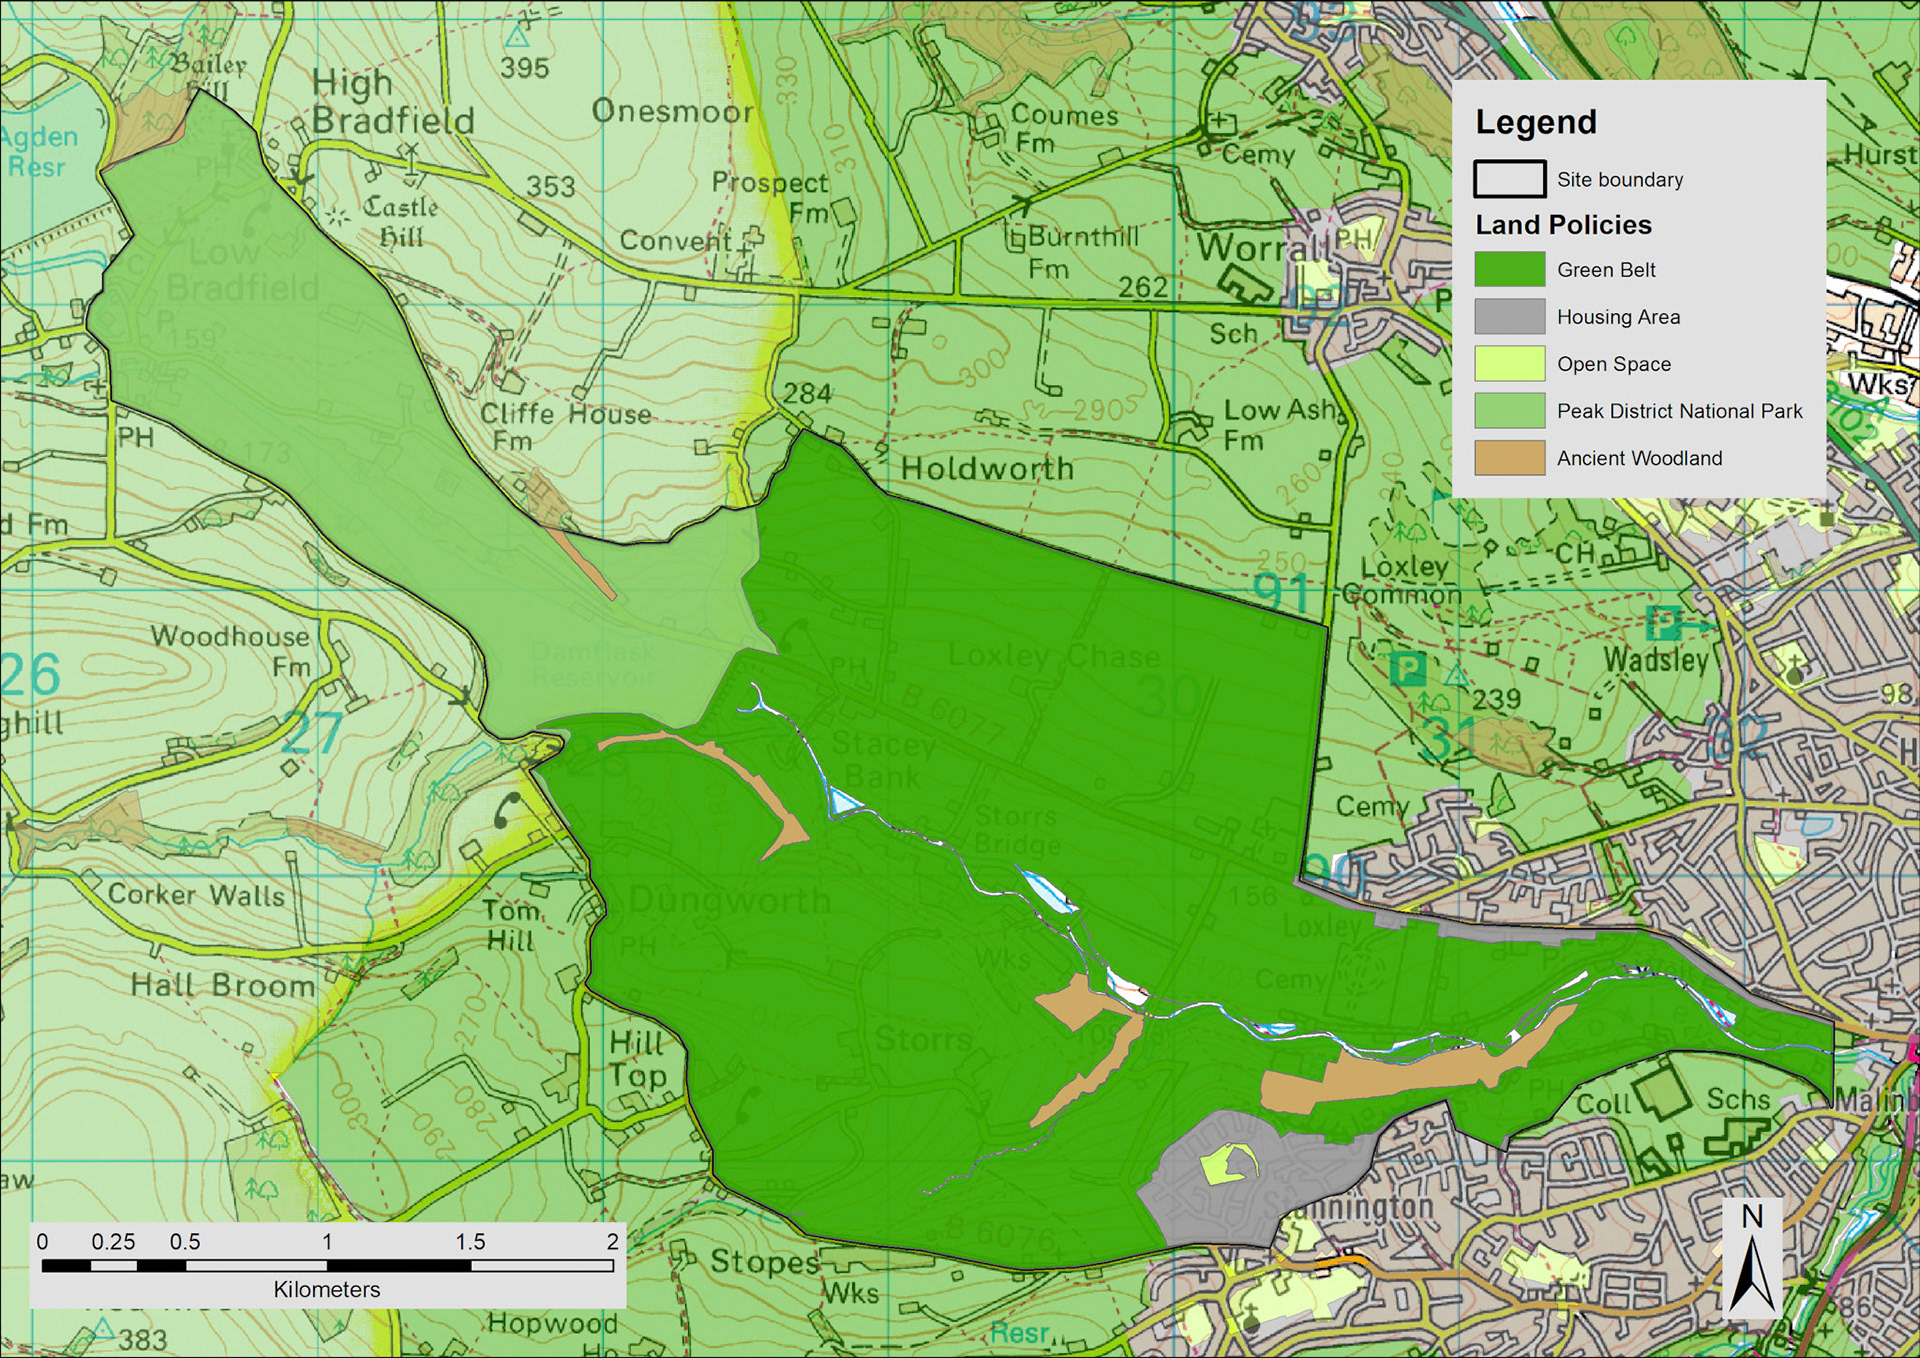
Policies
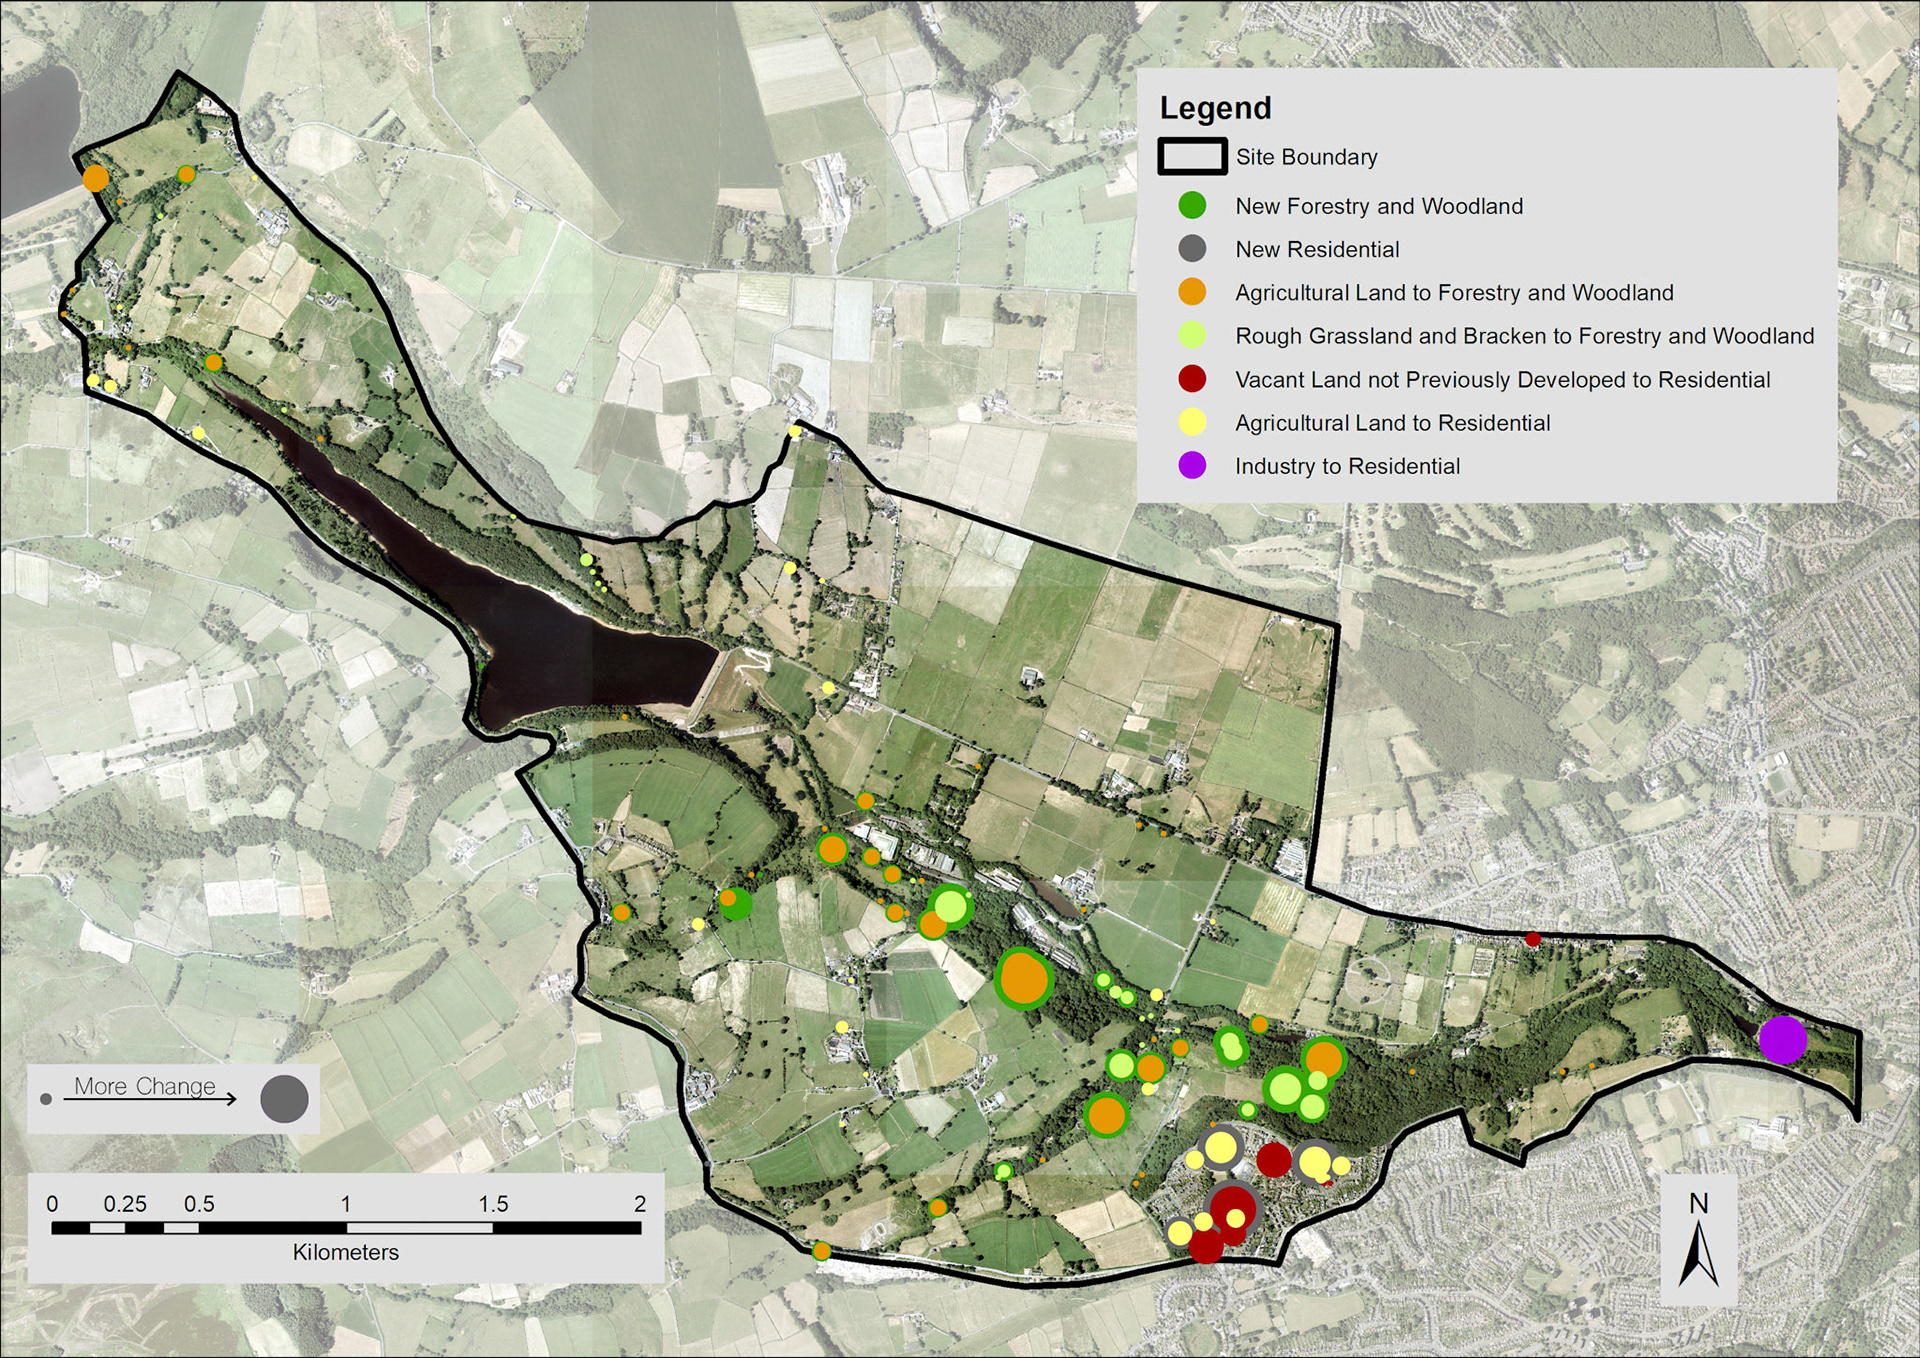
Landscape change
I really enjoyed this module, getting my head round arcGIS took some time but once I understood the principles of it I cracked on. A key component of this module was understanding what the data I was downloading actually meant. In some cases one dataset could be manipulated into multiple graphs and other times it was impossible.
In future work using arcGIS I would like to be more efficient with how I handle the data I download, trying to reduce the amount of time spent transforming data into a graph.